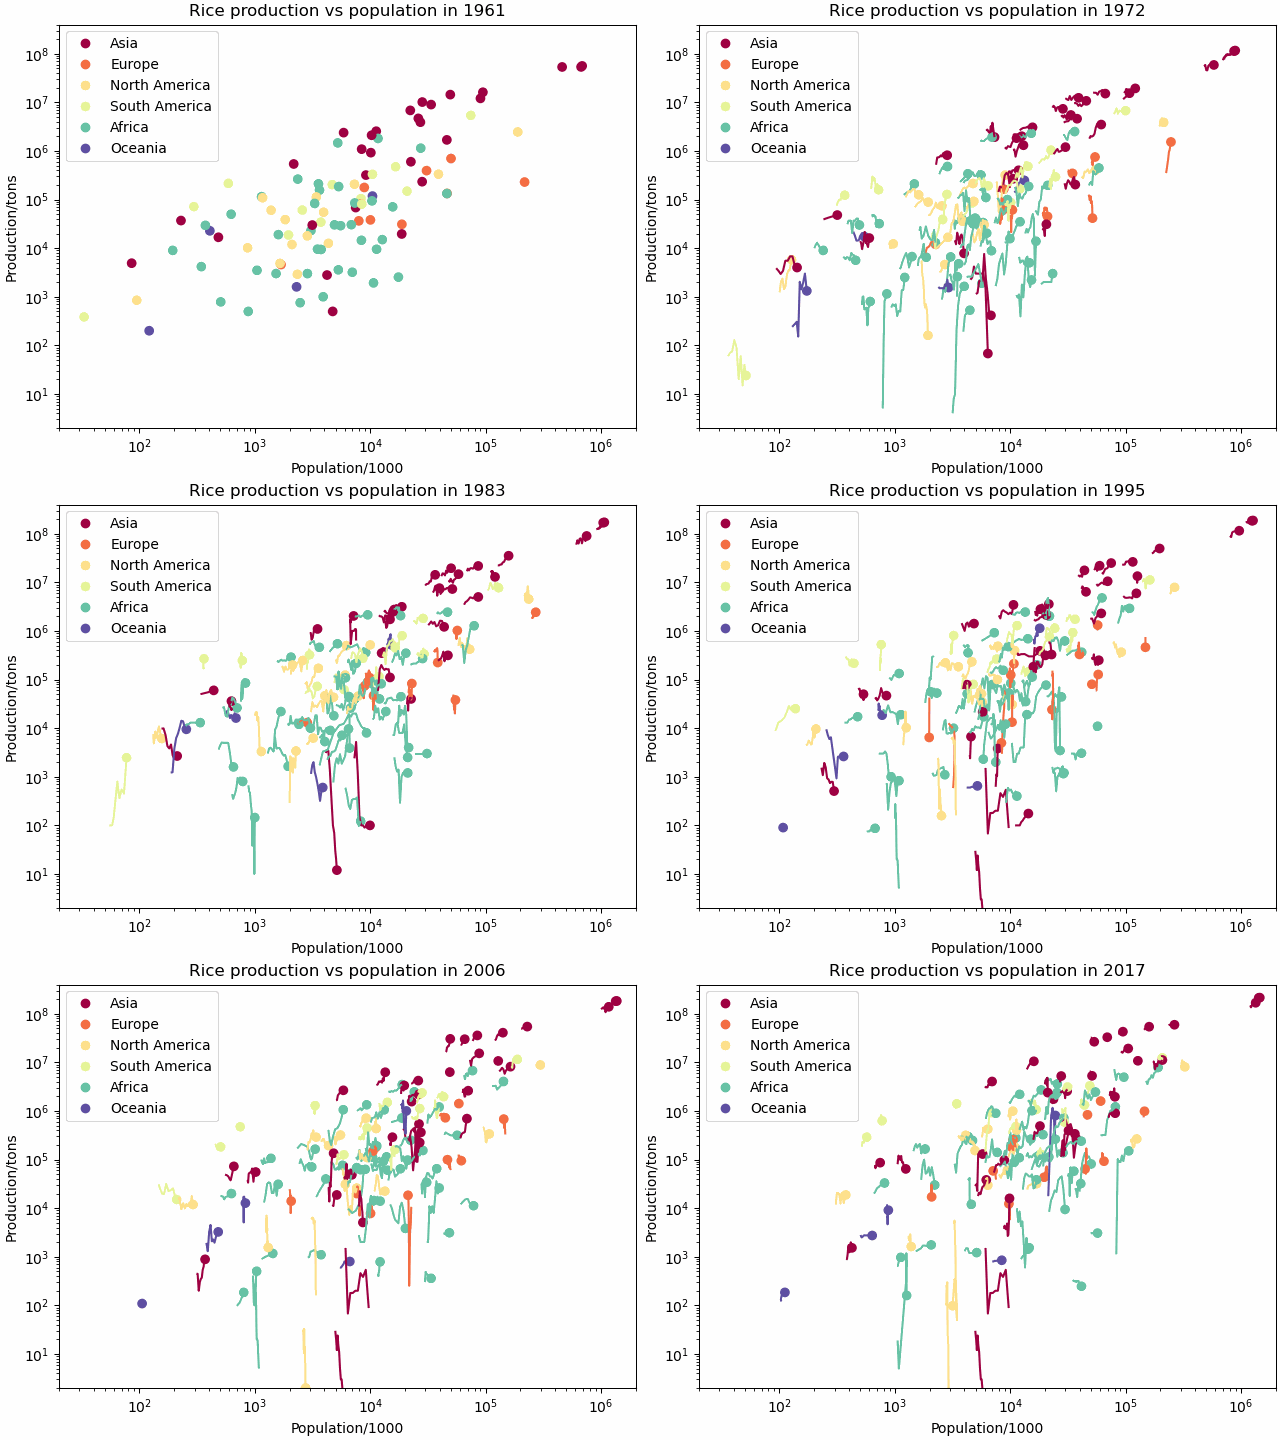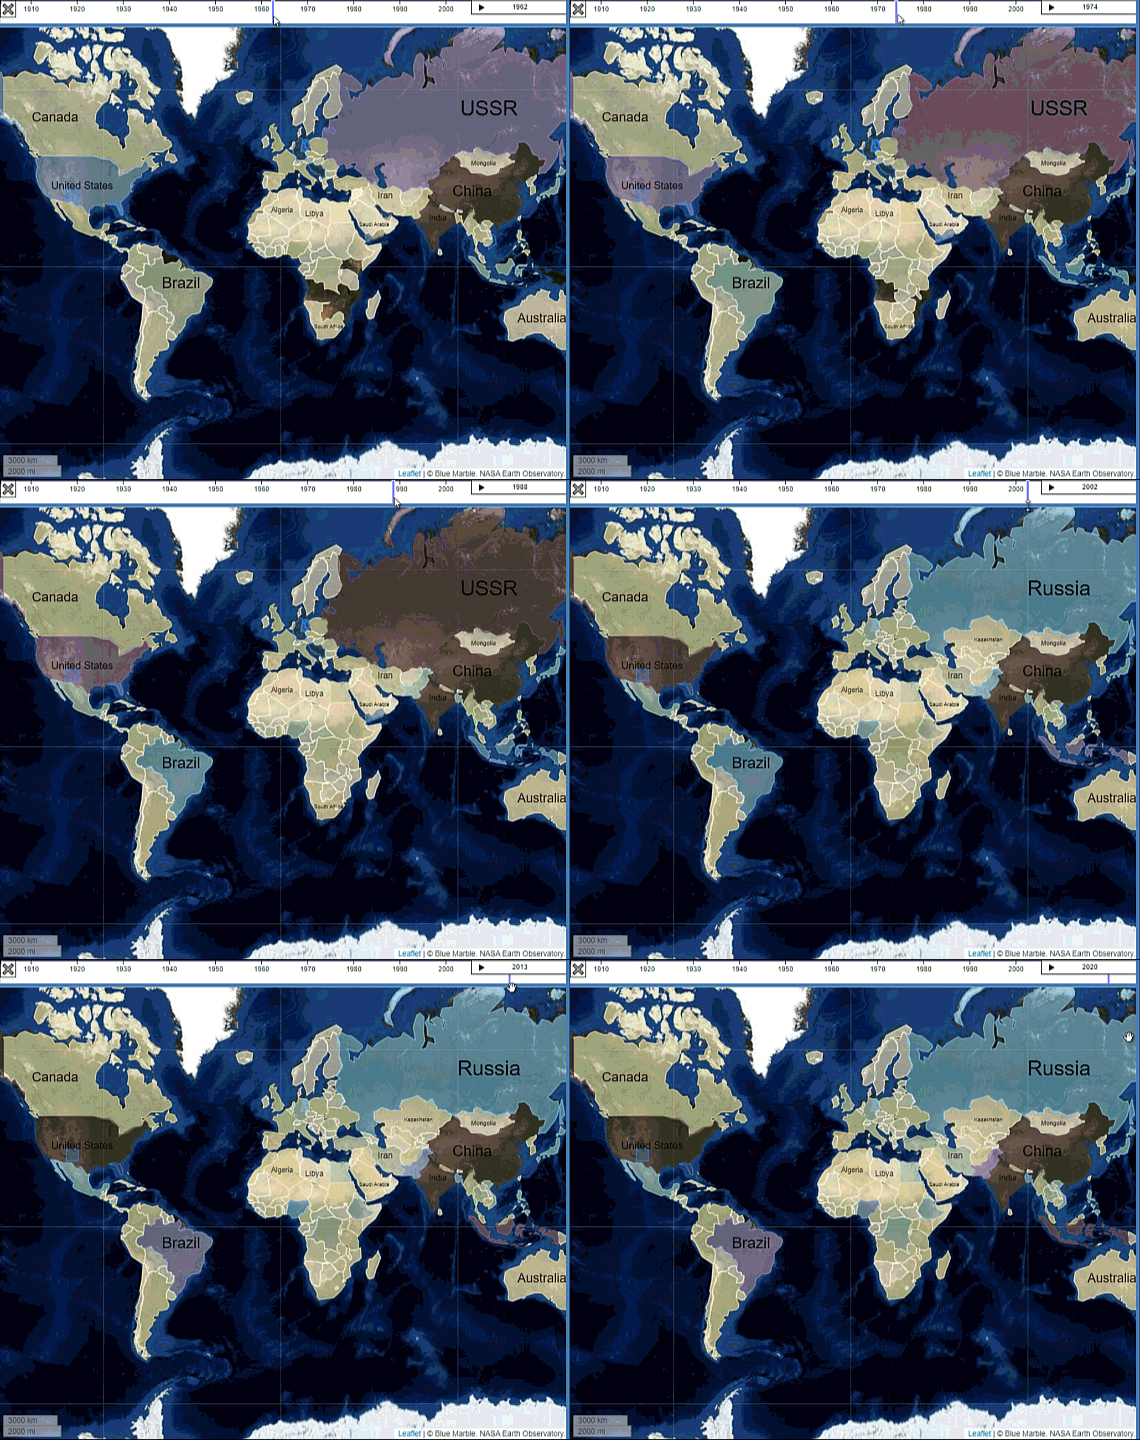
For some types of data, it is more useful to look at aggregate information rather than individual objects. You do not need to know about every sheep in New Zealand individually to understand that there are a lot of them. On xplris statistics allow for two directions of analysis. One is top down starting from statistics on many countries going to individual events. And one is bottom-up starting from individual events and the comparing to other countries via statistics.
The top down view allows you to look at a statistic such as a time series of food crop production data per country. If you find, for instance, a drastic dip in production you can check what events may be relevant in that country at that time. Was it a natural disaster, or a man made crisis? Or maybe it was an administrative change that did not even change production but rather the way it is accounted for.

On the other hand, starting from a local issue, for instance the impact of sheep farming on a country's economy and culture, statistics allow you to find parallels to other communities in different countries or at other times that may have faced similar problems but would otherwise not be linked in the web of historical connections.
Statistics thus provide a layer of parallel connections within a network of individual links.
In addition, the continuously growing database of connections between and properties of the historical objects gathered on xplris can be analyzed through the use of network analysis tools to create new statistics.